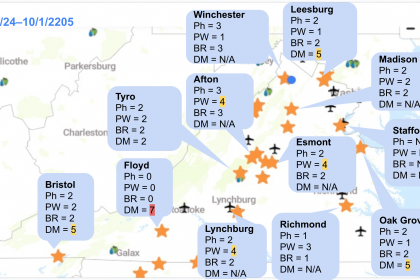
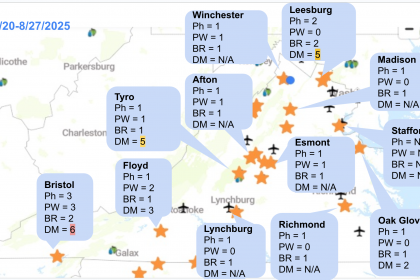
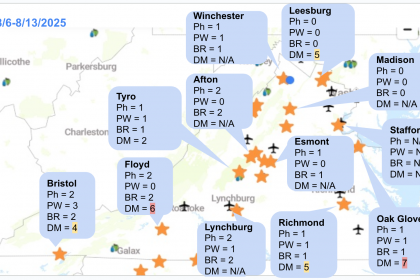
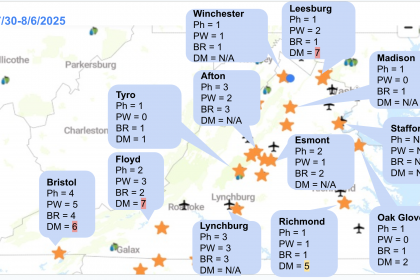
Here’s a snapshot from the last week, showing the number of days with the risk of each disease: Ph = Phomopsis, PW = Powdery mildew, BR = Black rot, and DM = Downy mildew. This information was made available through the Wine Board-funded Sentinel Vineyard project.
It seems that the central and southern VA experienced more wet conditions than the north. Downy mildew risk was high for many stations. (I am not sure why Eden, NC is all zero… I have a feeling the sensors are not reporting the right numbers at this site.) At the end of this posting, you will find a YouTube video that explains pre-bloom/at bloom grape disease management considerations.
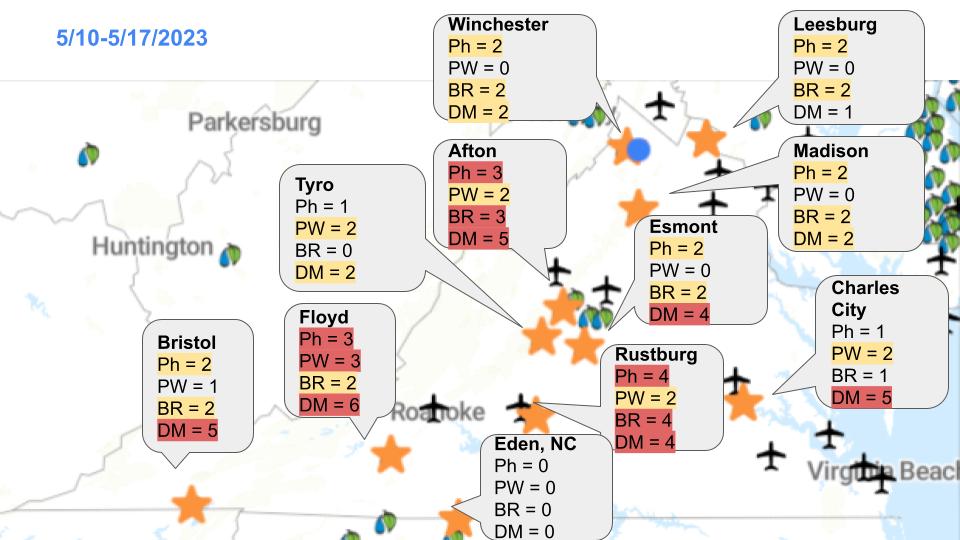
The image above is just a summary of the past seven days. Please visit https://newa.cornell.edu/ to obtain more detailed information. You can check daily weather data and disease and insect pest model results, including forecasted risks. We paid the annual fee so that growers in Virginia could freely access NEWA.
The risk information above is just output from the model to help you understand what happened. However, preparing your sprays to protect your vines would be best. One way to use this information is to adjust your spray intervals. If you see many days with disease risk(s), you may need to shorten your spray interval, or if you missed a material for downy mildew or black rot, you might wish to spray material(s) with kick-back activity. Or you may want to extend your spray interval, if you have not seen much risks as we have been experiencing this year.
It is essential to understand that the spray decision must be based not only on the weather condition but also on the cultivar and history of the disease(s) in your vineyard.
